Gallery
 PV cells and meter
 Clamp Ammeter with 10 turns
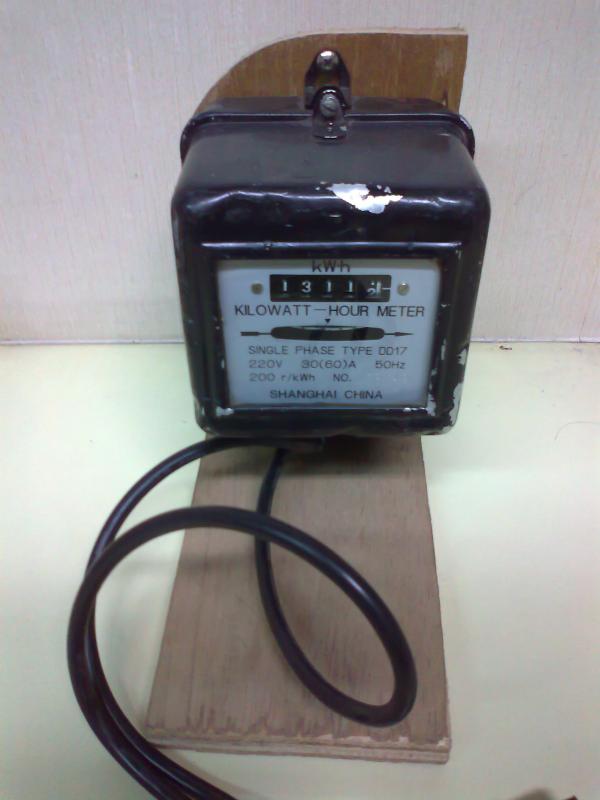 KWh meter
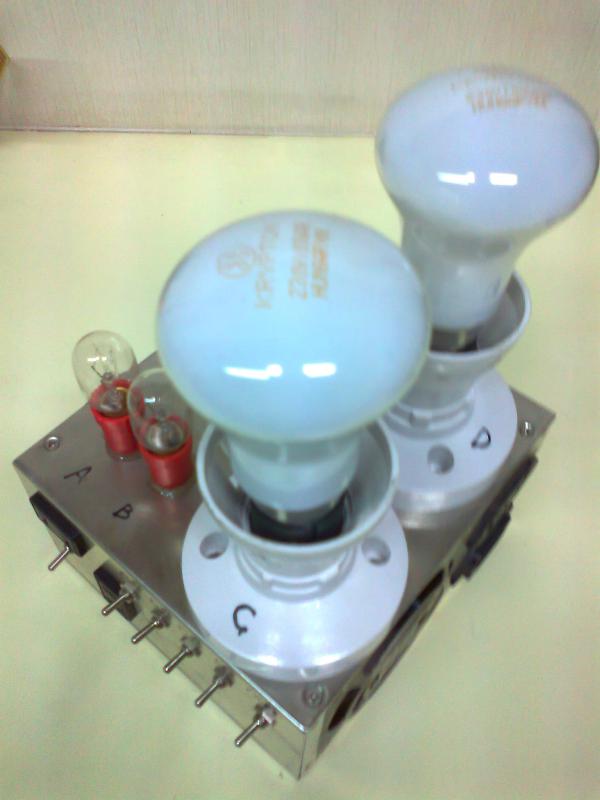 Non-inductive load and switches
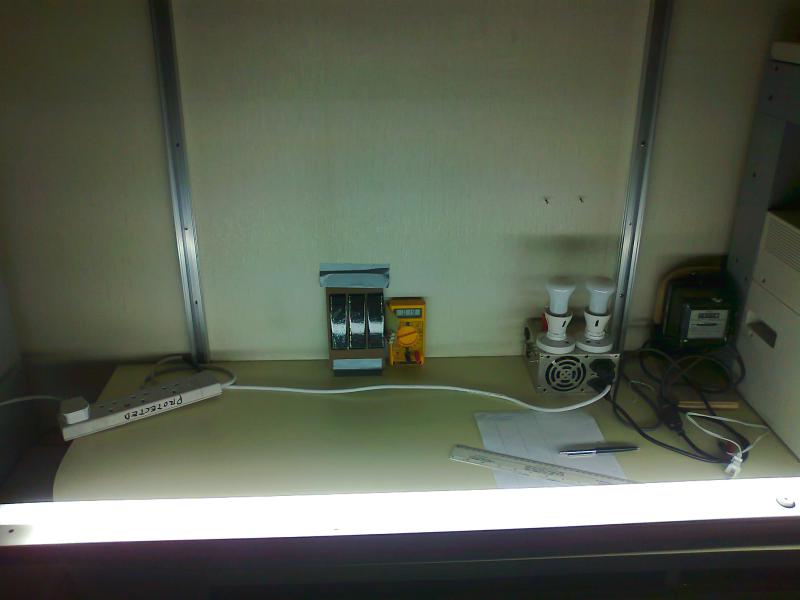 Complete test equipment
First published: 26th July 2011
The tubular fluorescent is the original energy-efficient lighting choice, commonly used in offices, factories and sometimes homes since the 1930's. Older lights have a 1.5 inch diameter tube (referred to as T12) in series with an electromagnetic ballast, with an automatic starter across tube. T8 tubes are 1 inch in diameter and are intended to be used with high-frequency electronic ballasts, but can also be used with an electromagnetic ballast. Both the T8 tubes and electronic ballasts are supposed to be more energy-efficient than their older equivalents. Even newer than T8 tubes are T5 tubes, just 5/8ths of an inch in diameter, they are different lengths to the T8 and T12's, so they cannot be used directly in an old light fitting. However, adapters exist.
The Hong Kong Government's "Guidelines on Energy Efficiency of Lighting Installations" notes, "An energy saving of up to 25% can be achieved when all the benefits are taken into consideration" when comparing an electromagnetic ballast to a high-frequency electronic ballast.
Having a large number of old fluorescent fittings with electromagnetic ballast, mostly fitted with T8 tubes, I wanted to get a better idea of the energy savings I could make. There were also several choices for how to upgrade the light fittings, and a question of whether replacement could be justified for light fittings that were seldom on (leaving a light off provides perfect, 100% energy saving, with no investment).
 Photovoltaic Cells and meter to measure the light output. There is a 100Ω load resistor, just visible in the photo, and the meter measures the voltage (in mV) across the load. It is assumed that the output from the PV cells is directly proportional to the incident light intensity.
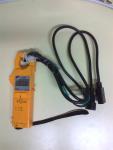 Clamp ammeter, to measure the current drawn by the light fitting under test. This ammeter has a resolution of 0.1A, so the power cable has been wrapped round the clamp ten times to provide a more accurate reading. The displayed current is therefore ten times the actual current, this has already been factored into the results table.
 KWh meter to measure the power drawn by the light fitting under test. The measurement was made by timing one rotation of the disc. This disc rotates 200 times for each KWh, so one revolution is 5Wh. Although the meter is quite sensitive, friction reduces the rotation speed at low speeds, so it becomes increasingly inaccurate when the power is less than 100W.
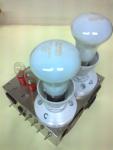 Non-inductive load used to bias the KWh meter into the linear part of its response curve. There are switches to control the four incandescent lamps and the load, and input and output sockets. For this experiment, two 100W bulbs were used as bias load for all readings.
During the experiment, each light fitting in turn was connected to mains power via the clamp meter, non-inductive load and KWh meter. The light fitting was turned on five minutes before the measurements were taken, to allow the light output to stabilise - some fluorescents are noticeably dimmer for a short time after they are switched on. The PV cell output was measured with all lights except the test fitting extinguished. The current was measured using the clamp meter. Then, the non-inductive load was turned on and one rotation of the KWh meter was timed, and finally, the test fitting was turned off and one rotation of the KWh meter with just the non-inductive load was measured. The mains voltage was measured once at the end of the tests.
The following components were tested:
| Abbreviation | Name | Description |
|---|---|---|
| B1 | Philips EB-S236TLD | High-frequency electronic ballast, capable of driving two 48 inch T8 tubes, but used for one in this test. |
| B2 | National GY40122MN-9 | Electromagnetic ballast for 40W T12 tube |
| B3 | OSCxx T5/28W | High-frequency electronic ballast for a 28W T5 tube that fits directly into a 48 inch T8 or T12 fitting. The instructions say that this can be used as a direct replacement for an older tube, by removing the automatic starter, without removing the old electromagnetic ballast. The tests were performed with and without the old ballast. |
| B4 | Silver Lighting RT-B5028 T5-28W | High-frequency electronic ballast for a 28W T5 tube that can be mounted on a flat surface. |
| L1 | Philips Lifemax TLD 36W/865 Cool Daylight | 48 inch T8 tube |
| L2 | GEC 40W-SD Daylight | 48 inch T12 tube. The tube failed before measurements were taken. |
| L3 | ST RM T5 28W 6500K | 1149mm T5 tube. |
| Mains voltage | 216V |
|---|---|
| Distance from light fitting to PV cells | 46cm |
Please refer to the table above for the abbreviation key.
| Ballast | Tube | Light intensity (PV cell output, mV) | Current (Clamp meter, A) | Rotation time, test load + bias load (s) | Rotation time, bias load (s) |
|---|---|---|---|---|---|
| B1 | L1 | 22.1 | 0.11 | 93 | 109 |
| B2 | L1 | 20.9 | 0.30 | 90 | 109 |
| B3 and B2 | L3 | 16.6 | 0.11 | 94 | 108 |
| B3 | L3 | 19.4 | 0.09 | 96 | 109 |
| B4 | L3 | 20.1 | 0.09 | 95 | 109 |
| Ballast | Tube | Light output1 | real Power (W)2 | Power Factor3 | Power Saving4 | Lighting efficiency5 |
|---|---|---|---|---|---|---|
| B1 | L1 | 106% | 28.4 | 96% | 19% | 130% |
| B2 | L1 | 100% | 34.9 | 43% | 0% | 100% |
| B3 and B2 | L3 | 79% | 24.8 | 83% | 29% | 112% |
| B3 | L3 | 93% | 22.4 | 92% | 36% | 145% |
| B4 | L3 | 96% | 24.3 | 100% | 30% | 138% |
From these figures, and adding the cost of the new equipment, it is possible to calculate the number of hours of operation before the savings have paid for the equipment. A one-for-one replacement is assumed, this results in a change in lighting levels, as noted in the Light output column of the first table above, but a change of 10% or less is probably not noticeable.
The cost for electricity is assumed to be HK$1.16
| Description | Ballast | Tube | Cost (HK$) | KWh to break-even | Operation hours to break-even |
|---|---|---|---|---|---|
| T8 with electronic ballast | B1 | L1 | 556 | 47.4 | 7349 |
| Original situation | B2 | L1 | 0 | 0 | 0 |
| T5 conversion, leaving old ballast in-place | B3 and B2 | L3 | 45 | 38.8 | 3864 |
| T5 conversion, removing old ballast | B3 | L3 | 45 | 38.8 | 3103 |
| Replacement with T5 fitting | B4 | L3 | 35 | 30.2 | 2866 |
There are many potential sources of error:
A couple of years ago, high-frequency electronic ballasts were still at a premium price point. They are now at a level where immediate installation is recommended in most cases.
Updated: 23rd October 2014
In the three years since writing the above, many of the T5 fittings installed at that time have failed, usually before the T5 tube failed. This still represents an overall saving compared to a T8 with electromagnetic ballast. I hope that the replacement fittings prove to be of better quality.
PV cells and meterClamp Ammeter with 10 turnsKWh meterNon-inductive load and switchesComplete test equipment